
After Russia's full-scale invasion of Ukraine, the number and variety of stressors experienced by Ukrainians increased significantly.
Combat operations, shelling, loss of loved ones, forced emigration, a difficult economic situation, uncertainty about the future, martial law restrictions, societal polarisation - this is just a small list of difficulties the Ukrainian nation faces every day.
In addition to the large number of stressors, it is important to note their duration - the acute phase of the war has lasted three years.
As a result, these factors create extreme mental strain. This means the risks of developing a wide spectrum of mental health problems increase significantly. In this situation, psychotherapy becomes particularly important - both for treating psychological difficulties, providing emotional support, and increasing psychological resilience to life challenges.
Various formats of psychotherapy are available in Ukraine - private specialists, charitable foundations, psychotherapy centres, etc. In particular, according to the study on working conditions of gestalt therapists, a therapist's services can be found at any price, including preferential and free consultations.
But do Ukrainians realise the importance of taking care of their psychological wellbeing? How do they feel about psychotherapy? Do they seek help from a specialist when needed, and if so - are they satisfied with the results?
This study is dedicated to finding answers to these questions.
Between 20 November 2024 and 5 January 2025, 1,021 people were surveyed. The survey was conducted via Google Forms, in Ukrainian. Completing the survey took 7 to 10 minutes.
The questions were designed to explore the perception of individual psychotherapy among three categories of people:
The survey was distributed through social media: Facebook, Instagram, Telegram, as well as via email newsletters.
Special thanks to the people and organisations who actively participated in distributing the survey, utilising their media resources:
Tetiana Stanislavska (channel "Psychotrauma of War")
Sasha Skladno, vocalist of bands "Zwyntar" and "Folkulaka"
Rostyslav Burlaka (online store "U Freida")
Ihor Lukianenko (online professional development school UpPro School)
Tetiana Podoriak
Vitalii Zhdanov
Olena Stupak
Nataliia Holomidova
Olha Kovalytska
Olena Cherepanova
And other people and organisations who directly or indirectly helped attract respondents.
1,021 people took part in the survey.
| Demographics | ||
|---|---|---|
| Gender | ||
| Male | 119 | 11.7% |
| Female | 884 | 86.8% |
| Prefer not to say | 15 | 1.5% |
| Age group | ||
| Young age | 52 | 5.1% |
| Early adulthood | 683 | 66.9% |
| Middle age | 266 | 26.1% |
| Old age | 20 | 2.0% |
| Education | ||
| Secondary | 41 | 4.0% |
| Vocational | 91 | 8.9% |
| Higher | 836 | 81.9% |
| Scientific degree | 53 | 5.2% |
| Place of residence | ||
| In Ukraine | 838 | 82.1% |
| Abroad | 183 | 17.9% |
| Settlement type | ||
| City | 1004 | 98.3% |
| Village | 17 | 1.7% |
| Marital status | ||
| Married | 515 | 50.4% |
| In a relationship, not married | 223 | 21.8% |
| Not in a relationship | 229 | 22.4% |
| Widowed | 8 | 0.8% |
| Divorced | 10 | 1.0% |
| Hard to say | 35 | 3.4% |
| Do you have children? | ||
| Yes | 606 | 59.4% |
| No | 415 | 40.6% |
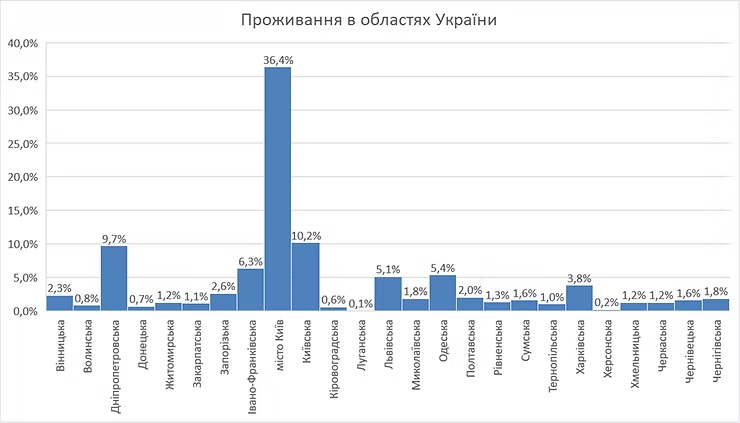
Among those living in Ukraine, the majority indicated Kyiv as their place of residence - 305 people (36%), others in various regions of Ukraine. The most represented regions: Kyiv (10.2%), Dnipropetrovsk (9.7%), Ivano-Frankivsk (6.3%), Odesa (5.4%), Lviv (5.1%), Kharkiv (3.8%).
Regarding participants living abroad, 38 different countries of residence were indicated in total. The two most popular countries were Poland (23.6%) and Germany (20.9%). Third place is shared by several countries - the USA, United Kingdom, Spain and Portugal, where 4.4% of respondents each reside.
Participants were also asked whether they belong to any of the following groups:
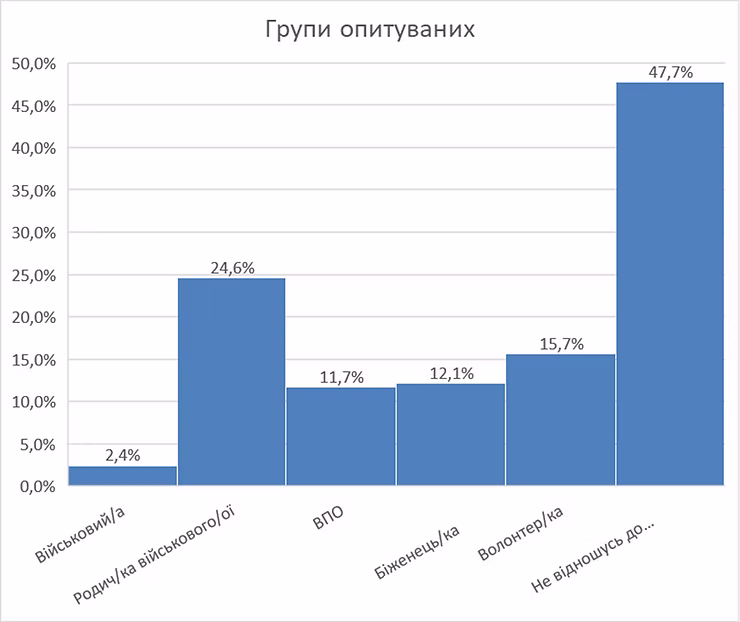
Survey participants were divided into three categories:
The numbers show that the number of respondents in these three categories is almost equal, which is convenient for comparison.
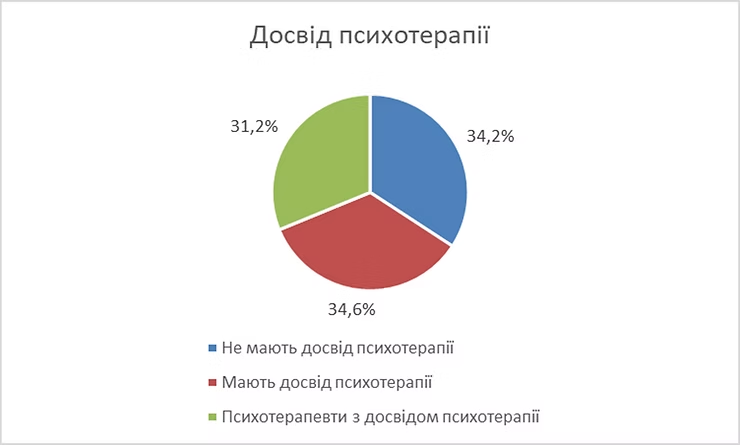
In the survey, we decided to classify all people who had only 1-2 individual psychotherapy sessions as those without psychotherapy experience. In our opinion, attending 1-2 sessions with a psychotherapist is not enough to form an impression of the psychotherapy process.
Among those who had not visited a psychotherapist, 57% noted that they have psychological difficulties they find hard to cope with on their own. At the same time, 71.3% indicated that they had wanted to seek help from a psychotherapist.
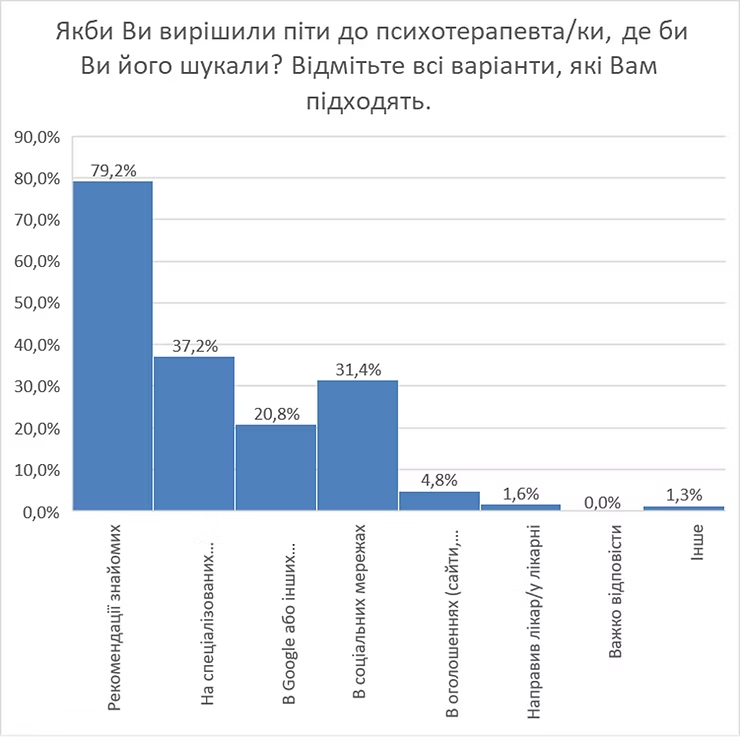
79.2% said they would search for a therapist among acquaintances, 37% on specialised platforms and websites, 31% on social media, 21% via Google or search engines.
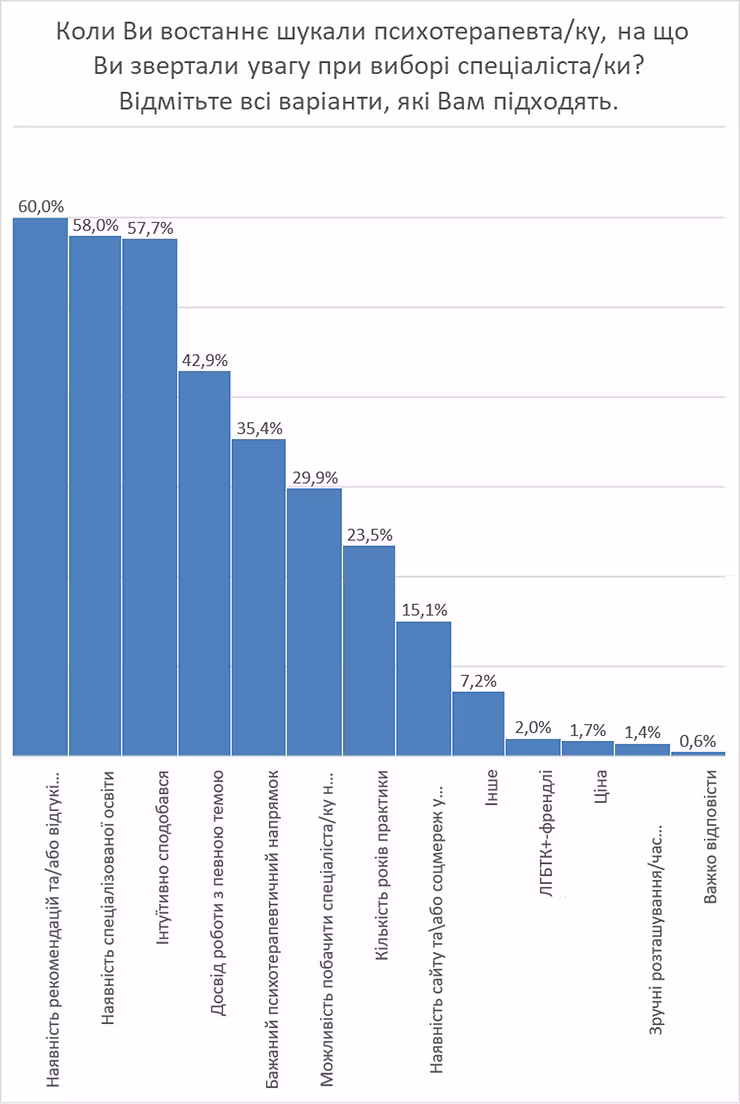
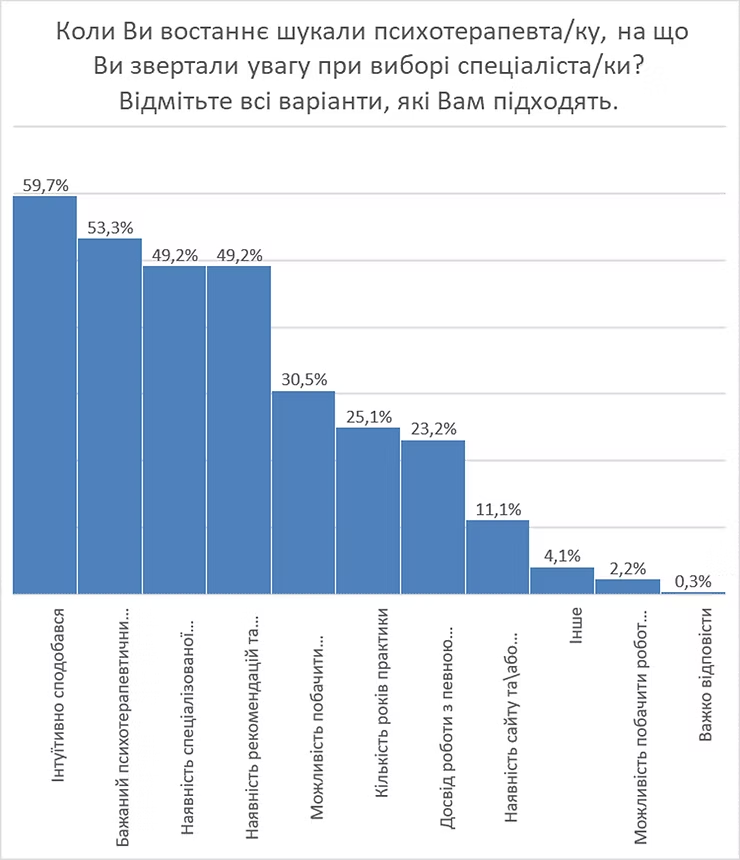
70% said they would look at specialised education, 68% at recommendations or reviews, 57% at experience working with a specific issue, 53% at intuitive appeal. Interestingly, the option "Having a website and/or social media" was not selected by a single respondent (0%).
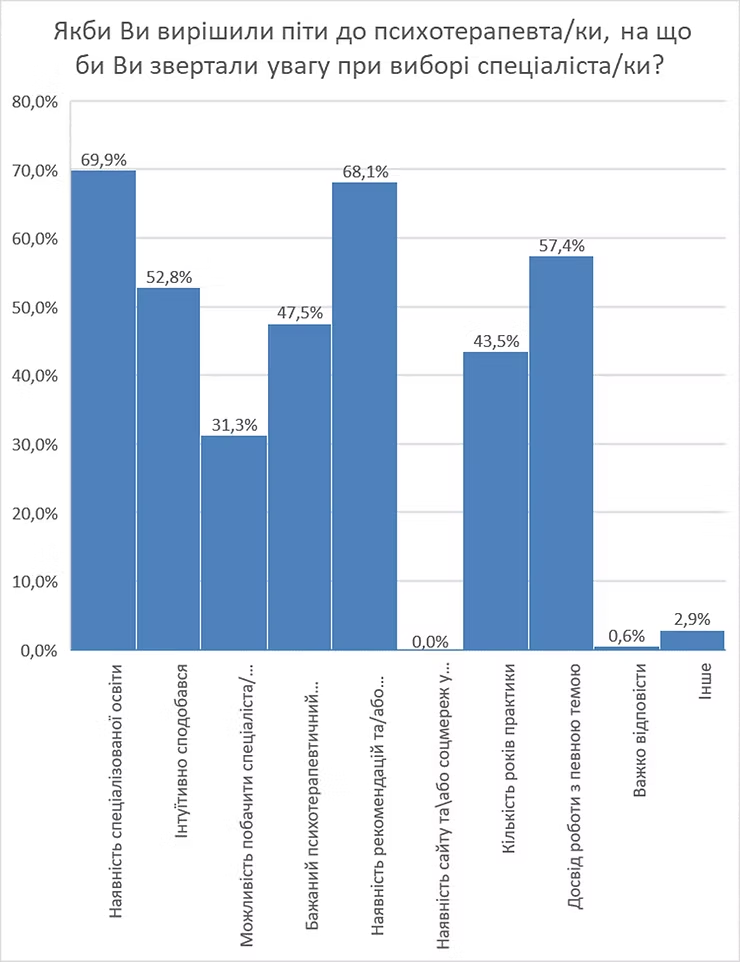
When considering seeing a psychotherapist, people without such experience rely most on recommendations from acquaintances (two-thirds of respondents). And they will pay close attention to the therapist's information - their education, work experience, photograph and overall appeal.
54.5% of people with psychotherapy experience are currently seeing a therapist or have done so in the last three months. Accordingly, 45.5% saw a therapist previously in the past.
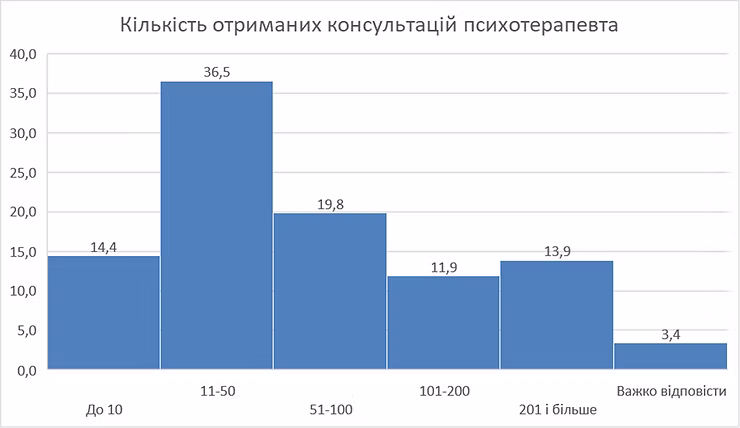
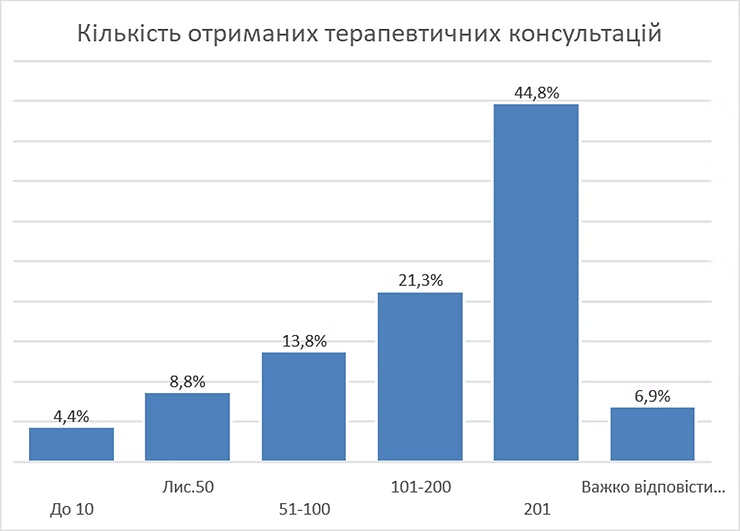
Regarding the number of sessions received (total, across all psychotherapy experience) - the most common was 11-50 sessions, at 36.5%.
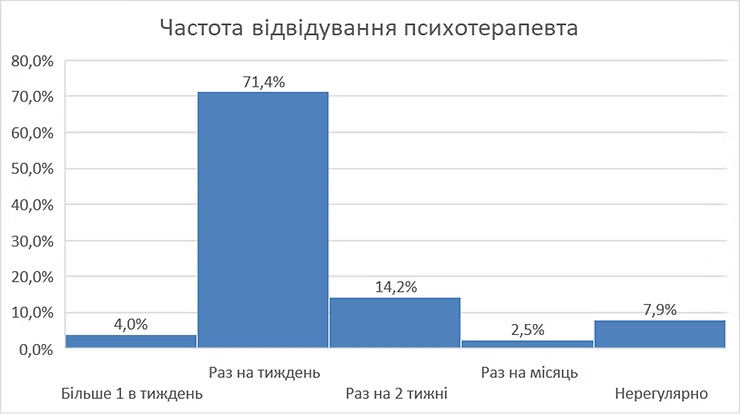
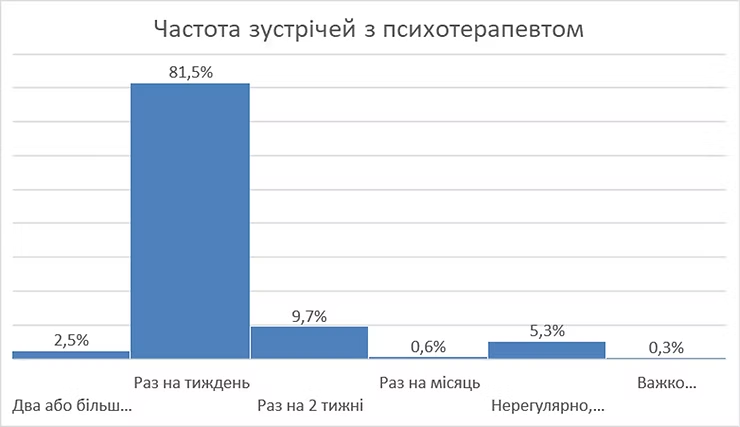
The most common frequency is once a week - 71.4%.
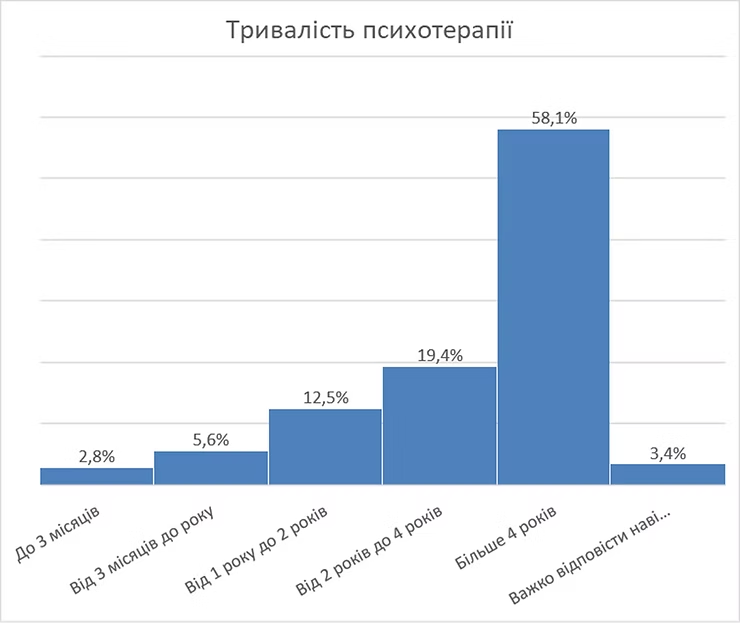
Most people attended for 3 months to a year (22.4%) or 1 to 2 years (22.1%).
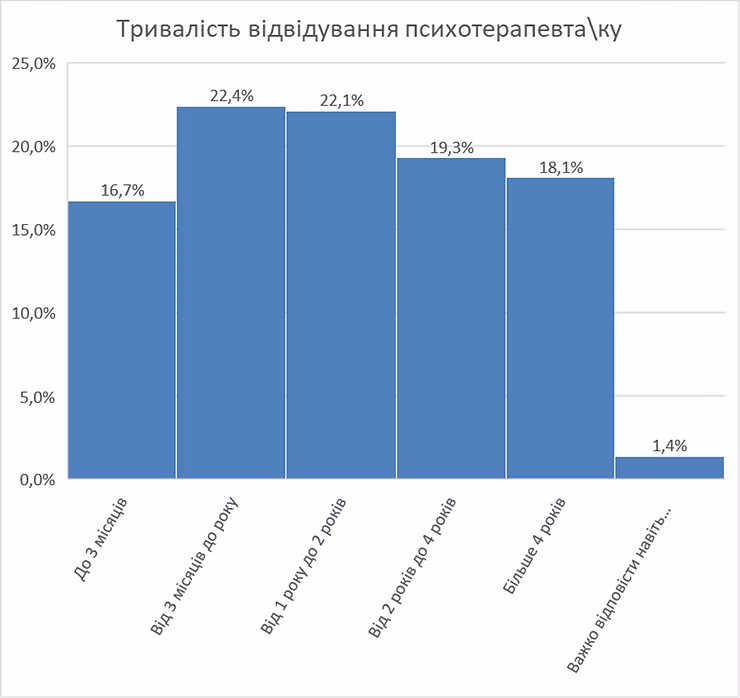
The vast majority of respondents attended a psychotherapist for 11 to 100 sessions (56.3%) lasting 3 months to 2 years (44.5%). Approximately 31% of those who started psychotherapy did not continue - 14.4% attended up to 10 sessions and 16.7% attended for up to 3 months.
Interestingly, only 4.4% of people with psychotherapy experience do not plan to see a therapist in the future. Meanwhile, 60.6% plan to do so, and 35% found it hard to answer.
83.5% of clients indicated they know which modality their psychotherapist works in.
Most commonly, clients have seen 1 to 4 specialists, with an average of 2 psychotherapists.
50% of respondents pay an average of $30 per therapy session. 25% pay up to $20, and another 25% pay from $40 to $300.
1.2% indicated they attend psychotherapy for free, 0.2% have their psychotherapy paid for by their employer, and 34.6% declined to state the price.
For all three questions (satisfaction, help in resolving difficulties, meeting expectations), the median score was 4 out of 5. That is, on average, people with psychotherapy experience are satisfied with the results.
Most psychotherapists have a psychology degree (78.7%) or are in the process of obtaining one (14.4%), but some do not have one (6.9%).
54.5% have a psychotherapy qualification, 38.9% are in the process of obtaining one. Interestingly, 6.6% indicated they do not have a psychotherapy qualification but consider themselves psychotherapists.
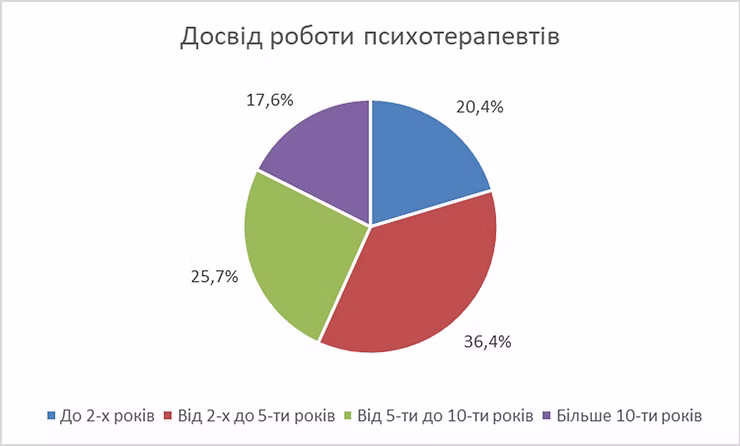
Work experience: 20.4% have been practising for up to 2 years, 36.4% for 2 to 5 years, 25.4% for 5 to 10 years, 20.4% for more than 10 years.
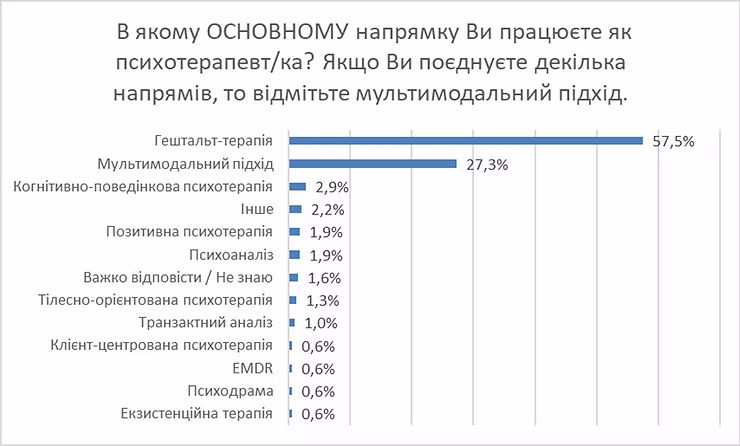
The vast majority of respondents belong to gestalt therapists or a multimodal approach. This is because the survey was more frequently distributed in gestalt therapy communities.
21 respondents (6.6%) indicated that they are psychotherapists but noted they do not have a psychotherapy qualification. They are all women (100%) with higher education (100%). 57.1% of them practise a multimodal approach, 28.6% - gestalt therapy.
78.7% of psychotherapists are currently attending or have attended a psychotherapist in the last three months. 88.2% plan to see a psychotherapist in the future. The median number of specialists therapists have seen is three.
Comparing these results with client experience shows that psychotherapists attend their own therapy for longer, have more sessions, and are more likely to attend once a week.
Psychotherapists pay approximately a quarter more for their own sessions than clients. 50% of therapists pay an average of $36 per therapy session. 25% pay up to $26, and another 25% pay from $50 to $208.
Median scores among psychotherapists are generally higher than among clients. Satisfaction - 5 points. Help in resolving difficulties - 5 points. Meeting expectations - 4 points.
| Total | Have experience | |
|---|---|---|
| Age | ||
| Young age 18-24 | 50 | 50% |
| Early adulthood 25-44 | 480 | 57% |
| Middle age 45-60 | 160 | 34% |
| Old age 60+ | 12 | 8% |
| Gender | ||
| Male | 106 | 53% |
| Female | 582 | 50% |
| Education | ||
| Secondary | 41 | 46% |
| Vocational | 87 | 32% |
| Higher | 541 | 53% |
| Scientific degree | 33 | 58% |
| Residence | ||
| In Ukraine | 591 | 47% |
| Abroad | 111 | 70% |
| Children | ||
| Have children | 379 | 40% |
| No children | 323 | 63% |
Young and early-adult people are significantly more likely to attend therapy, while elderly people rarely do. Men and women are equally likely to attend psychotherapy. The higher the level of education, the more likely the person is to seek therapy.
| Category | Count | % with experience |
|---|---|---|
| Military personnel | 21 | 29% |
| Close relative of military | 171 | 43% |
| IDP | 85 | 47% |
| Refugee | 67 | 76% |
| Volunteer | 101 | 60% |
| None of the above | 348 | 51% |
Military personnel are the least likely to have psychotherapy experience. Only 16.7% of military personnel indicated they see a psychotherapist. At the same time, 29.2% indicated they use alcohol or drugs - the highest rate among all categories.
| Method | No experience | Clients | Therapists |
|---|---|---|---|
| On their own | 87.6% | 88.0% | 78.4% |
| Turn to loved ones | 43.2% | 56.7% | 54.5% |
| Consultants (non-therapists) | 3.7% | 11.4% | 12.2% |
| See a psychotherapist | 0.0% | 71.8% | 95.0% |
| Church / faith | 15.0% | 12.5% | 12.9% |
| Alcohol or drugs | 11.5% | 16.8% | 8.8% |
| See a doctor | 9.8% | 37.0% | 30.4% |
| Discuss with authority figures | 17.6% | 14.0% | 17.6% |
| Distract with other activities | 45.0% | 43.3% | 34.8% |
| Ignore my difficulties | 17.6% | 24.8% | 10.0% |
Almost all psychotherapists seek psychological help. They are also less likely than others to use alcohol or drugs, distract themselves with other activities, or ignore their difficulties. This suggests that the profession of psychotherapist itself improves self-regulation skills and the ability to seek appropriate psychological help.
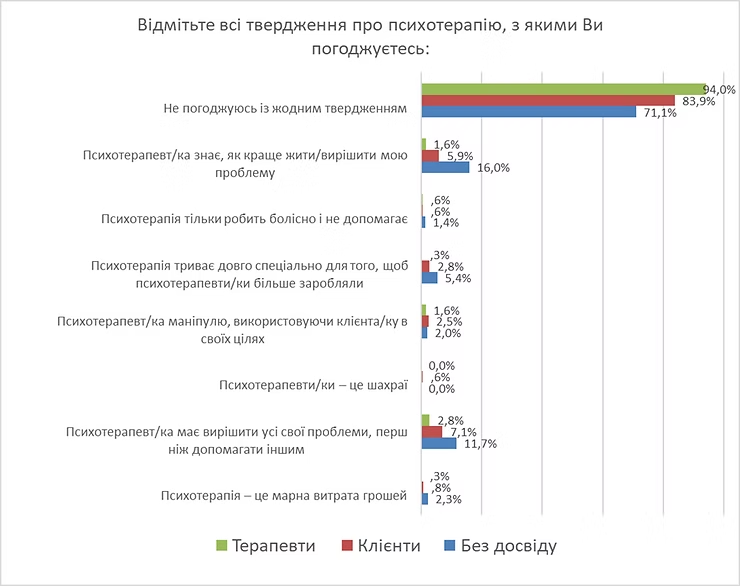
The highest percentage of responses disagree with the listed prejudices, which indicates a fairly high level of awareness about what psychotherapy is for. People without therapy experience are most prone to prejudice.
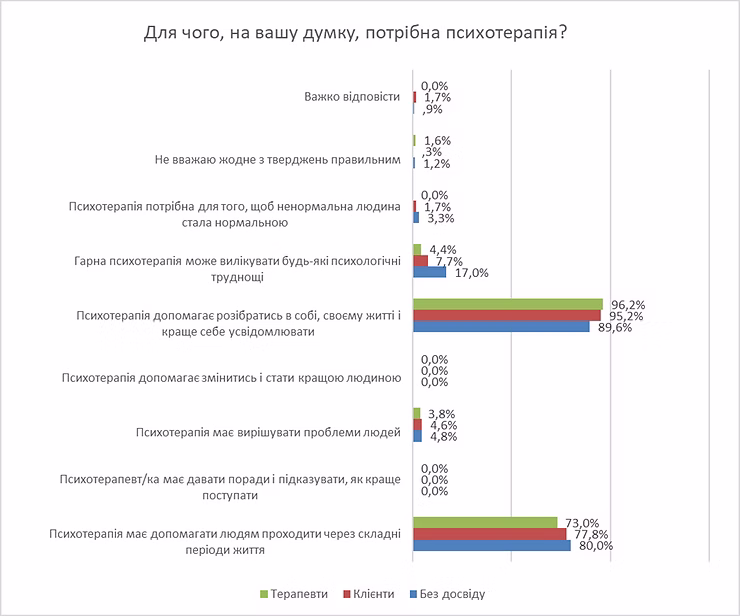
17% of people without psychotherapy experience believe that good therapy can solve any psychological difficulties - ignoring the limitations of psychotherapy.
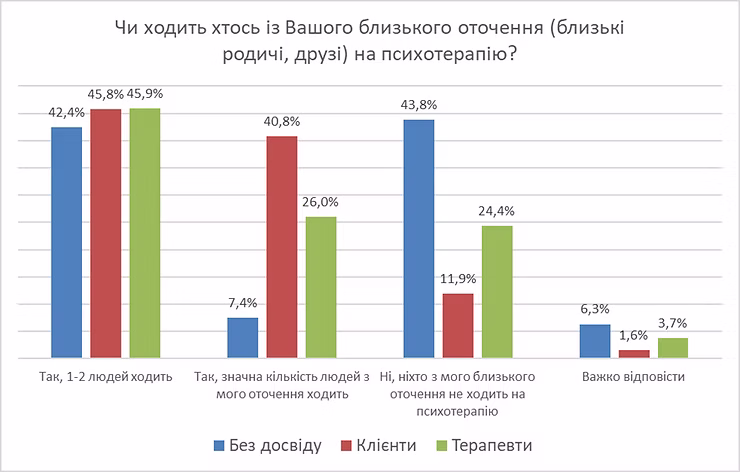
Among clients, the highest number of people in their close circle attend psychotherapy (86.6%). Half of people without therapy experience indicated that there are such people in their close circle.
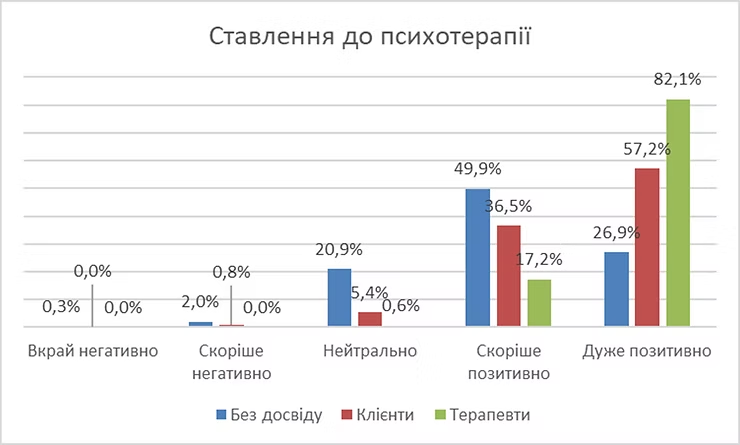
Overall, positive attitudes towards psychotherapy are high across all categories. Even people without experience have a fairly positive attitude. This may indicate a relatively high level of trust in psychological help among Ukrainians.
Those without experience think therapy should cost the least, clients support higher prices, and psychotherapists support the highest prices. No psychotherapist indicated that psychotherapy should be free.
Most commonly (28.4%), people without experience said therapy should cost 500-1,000 UAH. Most clients (32%) think 1,000-1,500 UAH. Most therapists (32.9%) consider a fair price to be 1,500-2,000 UAH.
15% are currently taking them, 19% took them in the past. That is, 34% in total. 47% said they have not taken them but would be willing to if needed. 17% are not willing to take them under any circumstances.
People with psychotherapy experience are 3 times more likely to currently take antidepressants (24.1%) than those without (6%). Among therapists, 13.8% indicated they are currently taking antidepressants.
The survey data shows an interesting cross-section and trends in public opinion about psychotherapy.
From the responses, one can conclude that respondents have fairly high psychological awareness: low levels of prejudice about psychotherapy and a high percentage understanding what it is needed for, along with a high level of positive attitudes towards therapy.
When considering seeing a psychotherapist, people without such experience rely most on recommendations from acquaintances (two-thirds of respondents).
Those with psychotherapy experience (compared to people without) more often acknowledge their psychological difficulties and are more likely to seek help.
34% of respondents are taking or have taken antidepressants, 47% are willing to take them if needed.
Psychotherapy is predominantly sought by people aged 18-44, while people over 60 rarely see a therapist.
Military personnel are the least likely to have psychotherapy experience. People who moved to other countries due to the war, on the contrary, seek psychological help more than other categories.
People with psychotherapy experience have on average seen 2 specialists. Most commonly, they pay $30 per therapy session. Clients rate their psychotherapy experience as satisfactory (4 out of 5).
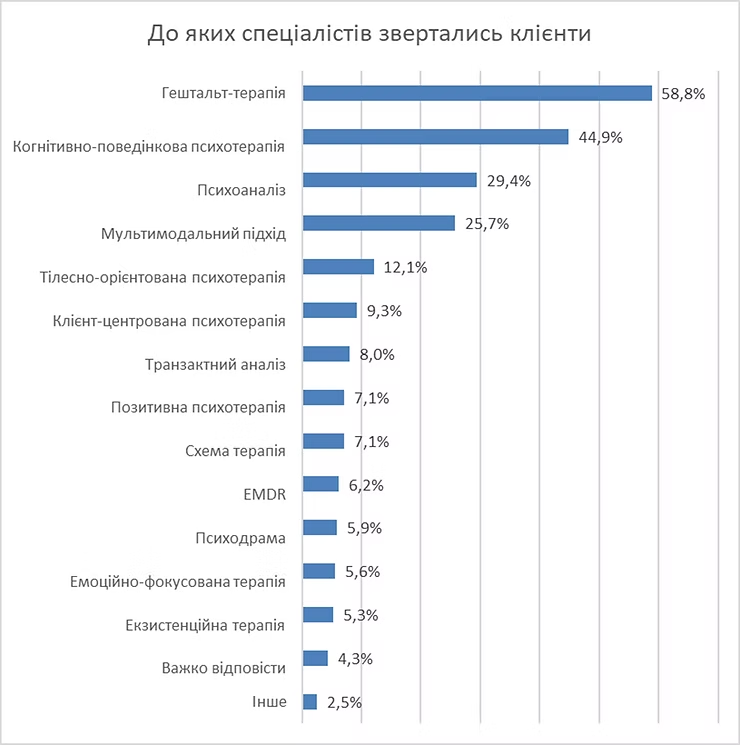
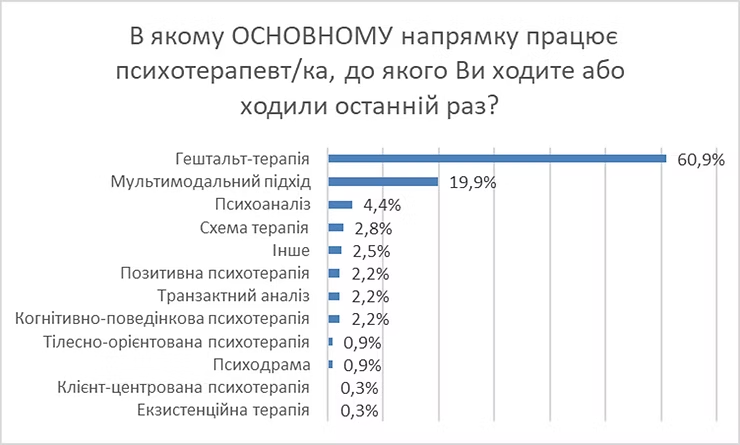
Most commonly, clients see gestalt therapists (58.8%), cognitive-behavioural therapists (44.9%), psychoanalysts (29.4%), and multimodal therapists (25.7%).
Psychotherapists themselves use psychotherapy services more often than clients - they attend their own therapy for longer (on average 4 years), have more sessions (on average more than 200), and are more likely to attend once a week (81.5%).
All Research